As you see, this post is written in Korean kanguage. If you can’t read Korean language, please turn on the translator on your Web browser.
기본적인 틀은 본인이 작성한 Basic_Armijo_gradient.py 을 주로 따른다. 단, Tensorflow는 사용하지 않는다.
Import Module
Tensorflow를 제외한 모든 Module을 가져온다. 이 중에서 argparser Module은 Argument를 Parsing 하기 위한 것으로서 “hevcbitrate.py” 코드를 보게 되면 잘 알 수 있다.
import matplotlib.pyplot as plt
from mpl_toolkits.mplot3d import Axes3D
from matplotlib import cm

import pandas as pd
import seaborn as sns
import numpy as np
import sys
import argparse
Initial Point
다음은 Initial Point 이다.
비선형 최적화를 위한 공통 시작점 Initial_point 과, 실제 비선형 최적화점 $X$를 잡아 둔다. Armijo Rule을 위한 Parameter가 존재하며 Algorithm 전체를 제어하기 위한 값이 존재한다.
num_point = 10

Initial_point = np.array([0.46, -0.47])

X  = np.array(Initial_point, dtype=np.float64)     # Main Training Parameter

# For evaluation of Armijo'rule
alpha             = 0.5
beta              = 0.612
Initial_StepSize  = 0.9

# Algoruthm Control
stop_condition    = 0.00003

bArmijo_On        = True
Constant_StepSize = 0.002
training_steps    = 100           # Maximum Number of Training Steps
Argument Parsig
프로그램에서 최적화 종류를 선택하기 위한 Argument Parsing Code 이다.
현재는 Constant Learning rate와 Armijo Gradinet만 지원하나 이후, 여러 알고리즘을 지원할 수 있도록 만든다.
다른 Python Program에서는 아래 코드가 잘 작동하지만, colab에서는 에러가 뜬다. 이유를 알아보도록 하고, colab에서 테스트 할 경우 해당 코드는 막도록 한다.
if False :
  # parse command line arguments
  parser = argparse.ArgumentParser(
      description="Nonlinear Optimization")
  parser.add_argument('-a', '--algorithm', help="Constant Learnig rate : 0 \n Armijo Gradient : 1", type=int)

  args = parser.parse_args()

  # Set Algorithm Type : It should be modified when a new algorithm is added
  if args.algorithm == 1 :
    bArmijo_On        = True
  else:
    bArmijo_On        = False
로젠브록 함수
로젠브록 함수(Rosenbrock function)는 수학적 최적화에서 최적화 알고리듬을 시험해볼 용도로 사용하는 비볼록함수이다. 하워드 해리 로젠브록이 1960년에 도입했다.[1] 로젠브록의 골짜기(Rosenbrock’s valley) 또는 로젠브록 바나나 함수(Rosenbrock’s banana function)라고도 한다. 함수식은 다음과 같다. \(f ( x , y ) = ( a − x )^2 + b ( y − x^2 )^2\)
그래프를 그려 보면, 길고 좁은 포물선 모양의 골짜기가 드러난다. 골짜기를 찾는 것 자체는 자명하다. 그러나 전역최솟값으로 수렴하는 것은 어렵다. 전역최솟값은 $f ( x = a , y = a^2 ) = 0$ 이다. 일반적으로 $a = 1 , b = 100$ 을 대입해 사용한다. \(f ( x , y ) = ( 1 − x )^2 + 100 ( y − x^2 )^2\)
여기서도 함수내부에 a=1, b=100으로 놓았다.
a = 1
b = 100
def inference(X):
    # compute inference model over data X and return the result

    Z = (a - X[0])**2 + b * (X[1] - X[0]**2)**2    #Armijo Rule을 위한 Evaluation (numPy)

    return Z
Stepsize evaluated by Armijo’s rule
Armijo Rule에 따른 Step size 계산.
def Armijo_Lambda(np_g, np_x, step_size, current_cost, bTestCase):
    # bTestCase : [True] Armijo Rule, [False] Constant

    if bTestCase:
        while True:
            Lambda = step_size * alpha
            xn = np_x - Lambda * np_g

            new_cost = inference(xn)

            #print("beta:", step_size, "new cost:",  new_cost, "lambda:", (step_size * alpha), "@", xn)

            if new_cost > current_cost:
                step_size = step_size * beta
            else:
                break
    else:
        Lambda = Constant_StepSize

    return Lambda
Gradient of Rosenblock Function
Rosenblock 함수는 다음과 같다.
\[f ( x , y ) = ( a − x )^2 + b ( y − x^2 )^2\]이것의 Gradient는 다음과 같다.
\[\nabla f(x,y) = \left( \frac{\partial f}{\partial x}, \; \frac{\partial f}{\partial y} \right)^T = \begin{pmatrix} -2(a-x) -4bx(y - x^2) \\ 2b(y - x^2) \end{pmatrix}\]def Calculate_Gradient(npX):
g_0 = -2 * (a - npX[0]) - 4 * b * (npX[1] - npX[0]**2) * npX[0]
g_1 = 2 * b * (npX[1] - npX[0]**2)
g = np.array([g_0, g_1], dtype = np.float64)
return g
Input
Rosenblock 함수를 도시하기 위한 부분으로 데이터의 범위를 지정하고 해당 범위에서의 Rosenblock 함수의 값을 표시하도록 하였다.
Contour 및 3D Surface를 그리기 위하여 Meshgrid 를 만든다. 즉, x, y 를 사용하여 $x \times y$ 를 만드는데,
실제 Input 값들에 대한 Rosenblock 함수 값을 받아 3차원 Mesh grid 형태로 표시한다. 주의할 점은 Z의 Dimension으로서 Meshgrid로 나온 2 Dimesnion의 값으로 만들어져야 한다는 점이다. \(f : \mathbf{R}^2 \Rightarrow \mathbf{R}\)
이기 때문에 차원이 독립적으로 표시된다고 하면 \(f : \mathbf{R}^4 \Rightarrow \mathbf{R}^2\)
이 될 것이다.
def Description_of_Object_Function(np_X, np_Cost):

    x = np.arange(-2.0, 3.0, 0.05)
    y = np.arange(-2.0, 3.0, 0.05)

    X, Y = np.meshgrid(x, y)
    Z = inference(np.array([X, Y]))

    return X, Y, Z
Plot Function
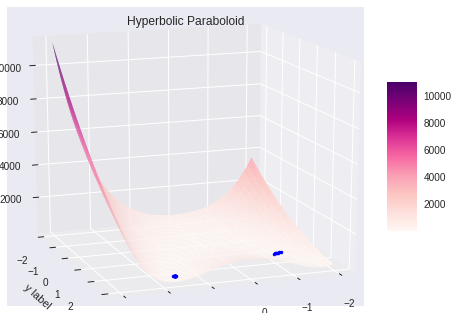
특별히 언급할 부분은 없다. 3차원 surface 환경으로 Plot 하고, $X$의 위치를 “*” 로 Scattering 방식으로 표시한다.
def plot_result(X, Y, Z, np_X, np_Cost):

    fig = plt.figure()
    ax = fig.gca(projection='3d')              # 3d axes instance
    surf = ax.plot_surface(X, Y, Z,            # data values (2D Arryas)
                           rstride=2,          # row step size
                           cstride=2,          # column step size
                           cmap=cm.RdPu,       # colour map
                           linewidth=1,        # wireframe line width
                           antialiased=True)


    # Point of X
    ax.plot(np_X[:,0], np_X[:,1], np_Cost, 'b.')


    ax.set_title('Hyperbolic Paraboloid')       # title
    ax.set_xlabel('x label')                    # x label
    ax.set_ylabel('y label')                    # y label
    ax.set_zlabel('z label')                    # z label

    fig.colorbar(surf, shrink=0.5, aspect=5)    # colour bar

    ax.view_init(elev=15,azim=70)                # elevation & angle
    ax.dist=8                                    # distance from the plot
    plt.show()
    return
Main Function
다음 Routine 부터 실제 Main Function이다. 나중에 Main Armijo Rule이라고 되어 있는 부분만 수정하여 각종 비선형 최적화 알고리즘을 테스트 한다.
#=================================================================
# Main Routine
#=================================================================
#Description_of_Object_Function()

prev_cost  = inference(X)
print("Initial f(x):", prev_cost, "at:", X )

# For record a simulation
rEpsilon = []
rCost    = []
rX       = []
rLambda  = []
#=================================================================
# Working Routine
#=================================================================
for step in range(training_steps):
  # step size는 매 Iteration 마다 초기화 되어야 한다. (정확한 stepsize는 Armijo Rule에 의해 계산되어진다)
  step_size = Initial_StepSize

  # Main Armijo Rule
  np_g      = Calculate_Gradient(X)
  np_lambda = Armijo_Lambda(np_g, X, step_size, prev_cost, bArmijo_On)

  X = X - np_lambda * np_g


  #epsilon 으로 Stop Condition을 Check한다.
  current_cost = inference(X)
  epsilon = prev_cost - current_cost
  prev_cost = current_cost

  #Programming Result
  if (step % 10 == 0):
    print('step: %3d epsilon: %4.8f  prev_cost: %4.8f current_cost: %4.8f ' %(step, epsilon, prev_cost, current_cost), "np_lambda", np_lambda, "X", X)
  rEpsilon.append(epsilon)
  rCost.append(current_cost)
  rLambda.append(np_lambda)
  rX.append(X)


  #실제 Process Stop은 이렇게 된다.
  if (step > 0) & (epsilon < stop_condition) : break

#=================================================================
# Final Routine
#=================================================================
print("")
print("=========== Final Result ===========")
print('step: %3d epsilon: %4.8f  prev_cost: %4.8f current_cost: %4.8f ' %(step, epsilon, prev_cost, current_cost), "np_lambda", np_lambda, "X", X)
Initial f(x): 46.749456 at: [ 0.46 -0.47]
step:   0 epsilon: 32.82641227  prev_cost: 13.92304373 current_cost: 13.92304373  np_lambda 0.014470131197658097 X [-1.33913508  1.50256828]
step:  10 epsilon: 0.11811309  prev_cost: 0.42595860 current_cost: 0.42595860  np_lambda 0.0007602930169841618 X [1.56381669 2.47839654]
step:  20 epsilon: 0.00005432  prev_cost: 0.32759190 current_cost: 0.32759190  np_lambda 0.0012423088512813101 X [1.57164374 2.47291945]

=========== Final Result ===========
step:  24 epsilon: 0.00000096  prev_cost: 0.32719171 current_cost: 0.32719171  np_lambda 0.0012423088512813101 X [1.57113625 2.47162363]
Plot of Result
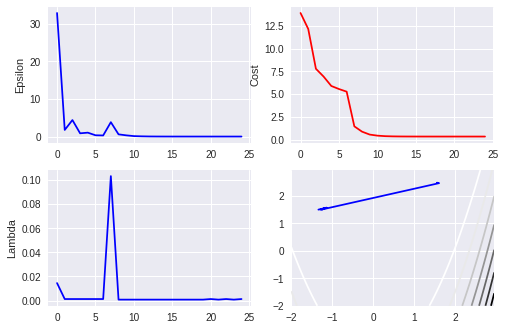
주요 데이터의 Plotting을 수행한다. 관련된 데이터들은 r로 시작되는 List를 사용한다. 해당 Routine을 함수화 시키지 않았는데 그 이유는 관련 코드를 snnipet하여 다른 곳에서도 사용하기 위해서이다.
4개의 Plot를 사용하는 데 좌상에서 부터 각각 $\epsilon = \Delta f(x)$, $f(x)$, $\lambda_t$, 그리고 $X_t$의 움직임이다.
맨 마지막 Plot는 $f(x)$함수로 나타나는 manifold 상에서 $X$가 어떻게 나타나는지를 표시하는 것이다.
# Data Management
time_index = range(step+1)
np_rX   = np.array(rX)
np_Cost = np.array(rCost)
X, Y, Z = Description_of_Object_Function(np_rX, np_Cost)

# plot dub-figure (trend of epsilon, cost, Lmabda and trace of X)
plt.subplot(221)
plt.plot(time_index, rEpsilon, 'b')
plt.ylabel('Epsilon')
plt.legend

plt.subplot(222)
plt.plot(time_index, rCost, 'r')
plt.ylabel('Cost')
plt.legend

plt.subplot(223)
plt.plot(time_index, rLambda, 'b')
plt.ylabel('Lambda')
plt.legend

plt.subplot(224)
plt.contour(X, Y, Z)
plt.plot(np_rX[:,0], np_rX[:,1], 'b')

plt.show()

# 3D plot of Object function and Distribution of X
plot_result(X, Y, Z, np_rX, np_Cost)


Comments